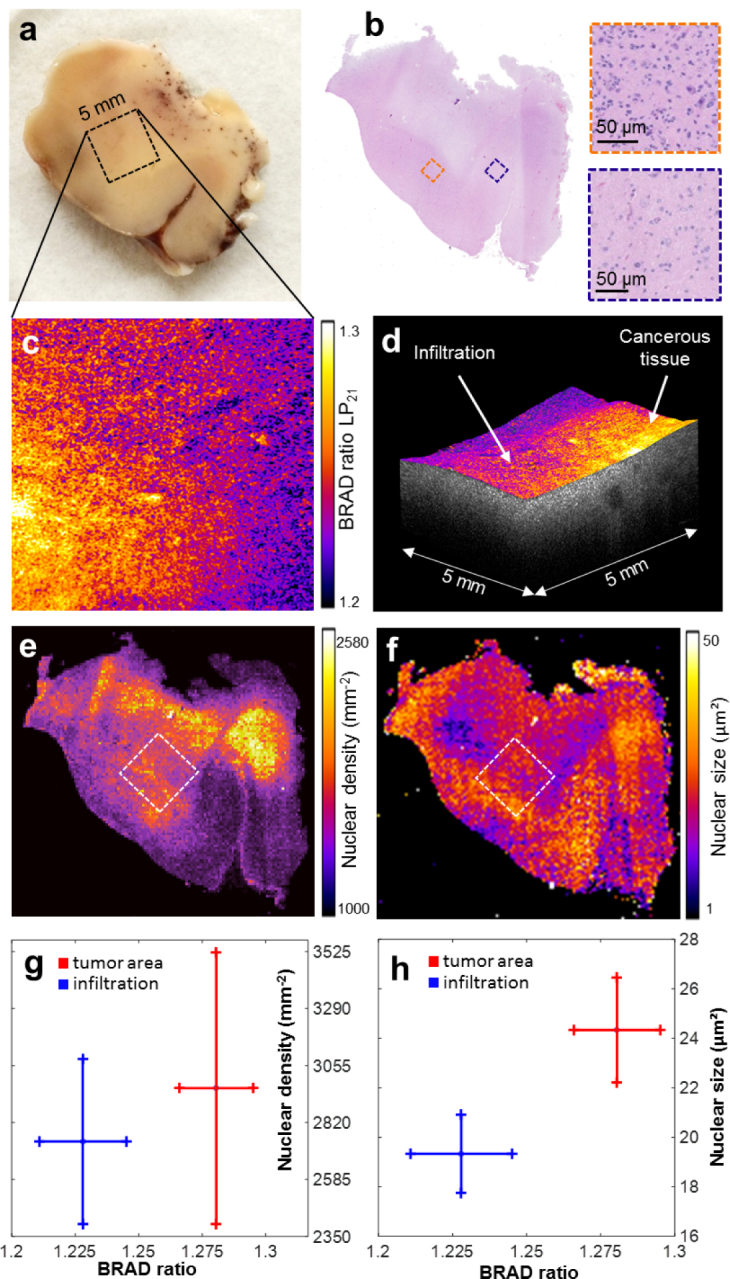
Fig. 6.

BRAD-OCT in cancer imaging. (a) Macroscopic image of a temporal lobe resection partly infiltrated by glioblastoma (note petechial bleedings in the white matter). The scanned area is indicated by a square. (b) En face map displaying the BRAD ratio of LP21 and LP01 revealed different scattering characteristics for the cancerous area as compared to the adjacent brain parenchyma. (c) The corresponding histological scan of the brain sample after OCT imaging revealed adjacent brain parenchyma of low cellularity (blue box). In contrast, tumorous tissue (orange box) is associated with increased cell density and wide variations in the nuclear size and shape. (d) Representative OCT volume of the scanned area with overlaid BRAD map indicating the tumor area and infiltration zone. (e) Nuclear density map by digital histology. (f) Nuclear size map. (g) Comparison of BRAD ratio with nuclear density in an area of tumorous and adjacent tissue, respectively. (h) Comparison of BRAD ratio with nuclear size.
