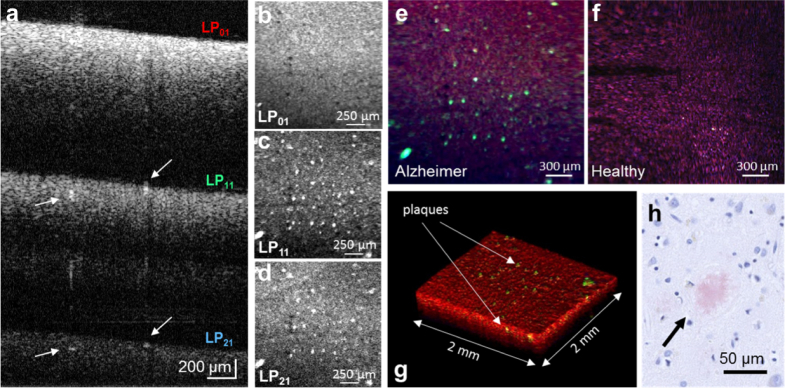
Fig. 7.
BRAD-OCT of neuritic plaques in Alzheimer’s disease. (a) OCT depth-multiplexed B-scan images of a brain from a late-stage Alzheimer’s patient for the LP01, LP11 and LP21 modes. Neuritic plaques can be observed as hyper-scattering structures particularly showing up in the B-scans obtained by the higher-order modes. (b–d) En-face intensity projection images for LP01, LP11, and LP21. The bright field scattering collected by the fundamental mode LP01 (b) does not enable clear differentiation of neuritic plaques while the higher modes (c – d) enhance the contrast between plaques (arrows in (a)) and the surrounding tissue. The combination of the modal en face projections in the channels of an RGB image provides an easy discrimination between (e) Alzheimer affected and (f) non-affected tissue, highlighting the neuritic plaques in the green channel. (g) Volume rendering encoding all modal information in an RGB channel. (h) Histologic section of a neuritic plaque highlighted with Congo red stain scanned after applying BRAD-OCT.

