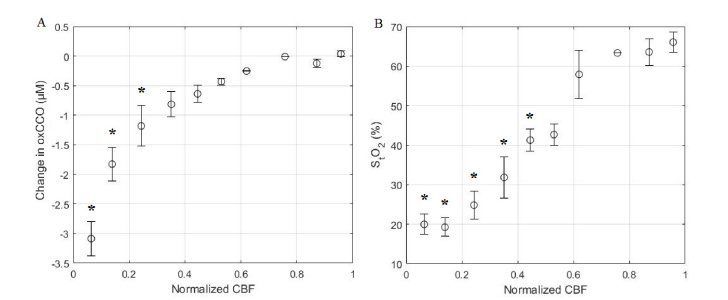
Fig. 8.
Correlation plots of a) oxCCO vs CBF, and b) StO2 vs CBF; * indicates a significant change in either oxCCO or StO2 from baseline (p<0.05). Error bars represent the standard error of the mean. CBF intervals with mean values of 0.62 and 0.76 show only data from two and one animals, respectively.

