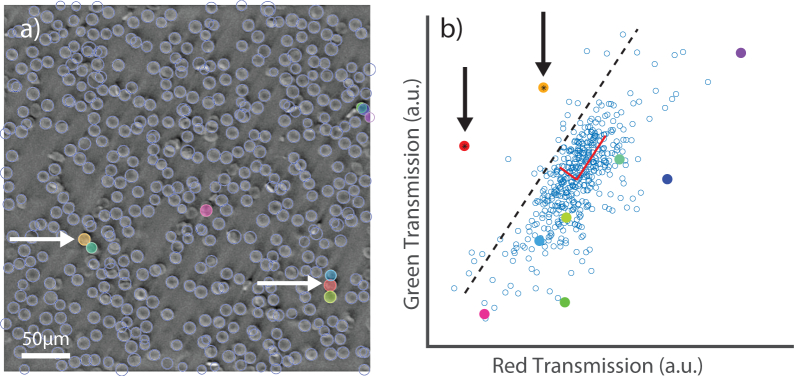
Fig. 5.
The transmission stage of detection. (a) The green phase image with candidate cells highlighted in color (b) scatter of green versus red transmission of each detected cell. The points with candidate cells are given the same corresponding color as the overlay. The cells identified by eye to be WBCs (arrows, left), are correctly selected by their characteristic transmission (arrows, right). The dotted line in (b) indicates the cutoff distance beyond which candidate cells are determined to be WBCs.

