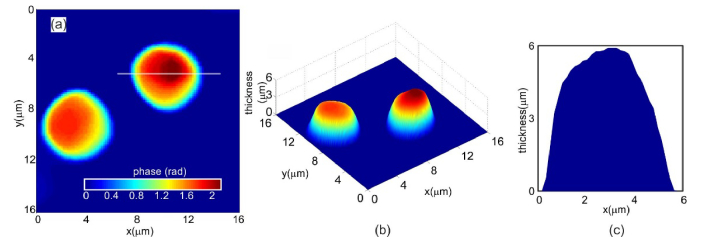
Fig. 2.
(a) Quantitative phase image of the polystyrene microspheres obtained after thresholding the phase map. (b) Reconstructed thickness profile of the microsphere obtained by plugging the quantitative phase information shown in Fig. 2(a) into Eq. (1). (c) Cross-sectional thickness profile of the polystyrene microspheres along the line shown in Fig. 2(a).

