Fig. 2.

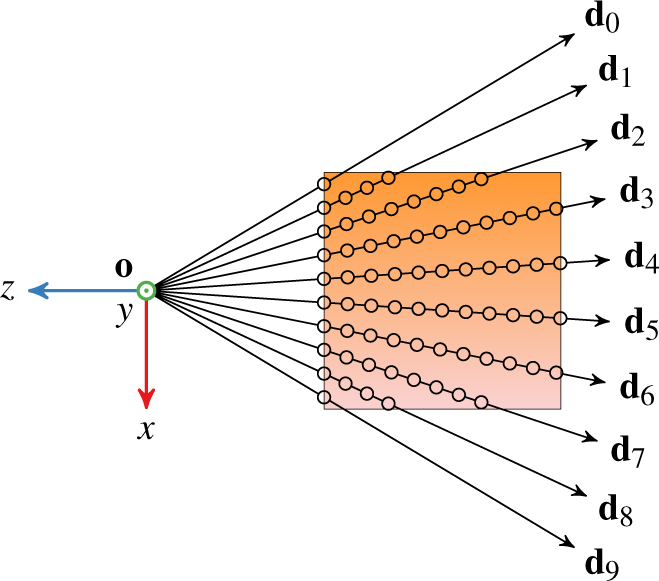
Illustration of sampling the volume with ten rays. Each ray samples the volume at a fixed interval from entry until exit. Circles denote the sample positions.

Illustration of sampling the volume with ten rays. Each ray samples the volume at a fixed interval from entry until exit. Circles denote the sample positions.