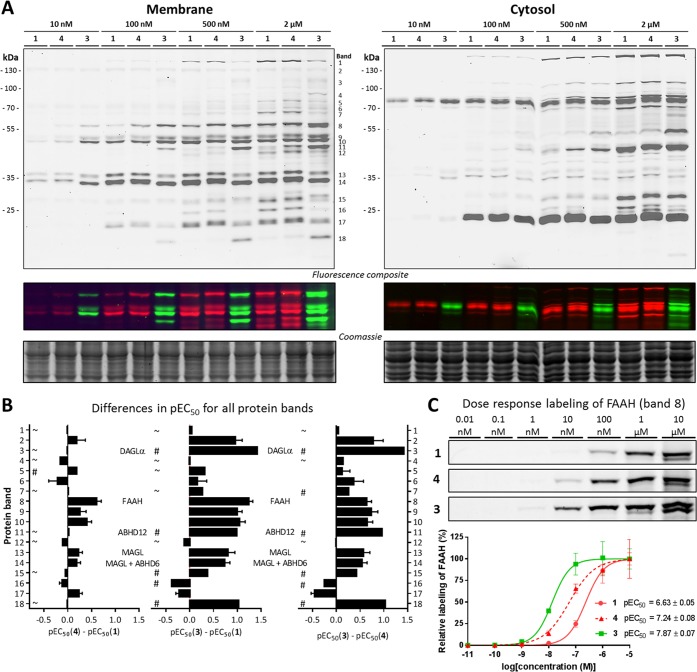
Figure 2.
Concentration dependent labeling of probes 1, 3, and 4. (A) Four doses of the FP probes label the mouse brain proteome in a distinct pattern with different affinities. (B) Quantified affinity differences among the evaluated FP probes for the 18 bands denoted in A. A # indicates a pEC50 ≤ 6 for one of the two probes, meaning that the difference is most likely greater than the given value. A ∼ indicates a pEC50 ≤ 6 for both probes, meaning that both probes label these proteins only at high concentrations. All quantifications assumed 100% labeling of protein at 10 μM probe. (C) Example of the labeling pattern of band 8 (FAAH) and corresponding pEC50 curves and values.

