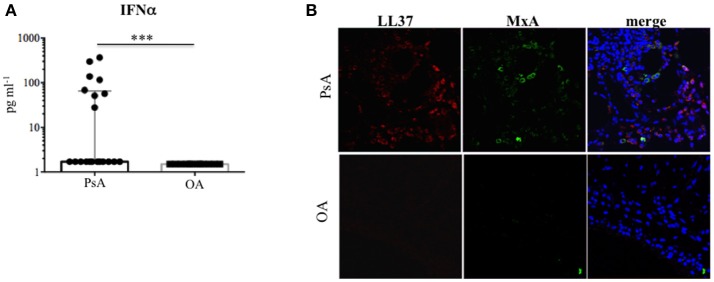
Figure 11.
Type I IFN in the synovial compartment of PsA. (A) IFNa was measured by ELISA in SF of PsA (N = 20) and OA (N = 12) subjects. Data are shown as median with Interquartile Range (IQR). P-value is calculated by two-tailed Mann-Whitney U test ***p < 0.001. (B) Confocal microscopy images of synovial tissues of one PsA and one OA patient stained for LL37 (red) and MxA (green) (original magnification, 63x). Data are representative of 7 PsA patients and 4 OA subjects.

