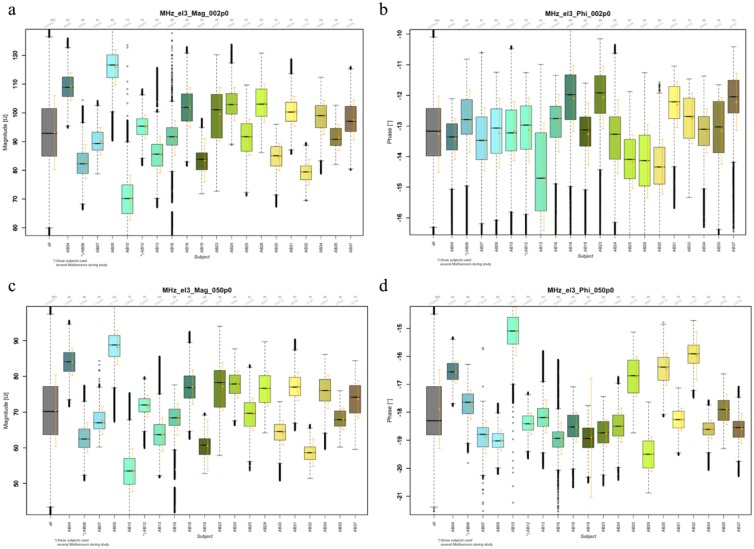
Figure 2.
Boxplots of signal distribution for two channels (2 and 50 MHz, a, b and c, d respectively) measured with the long electrode and parametrized by magnitude (a, c) and phase (b, d). Mean and standard deviation are also given (orange). Given over all patients/devices (gray) and per patient/device. One device per patient, except AB06 and AB12 that used several devices.

