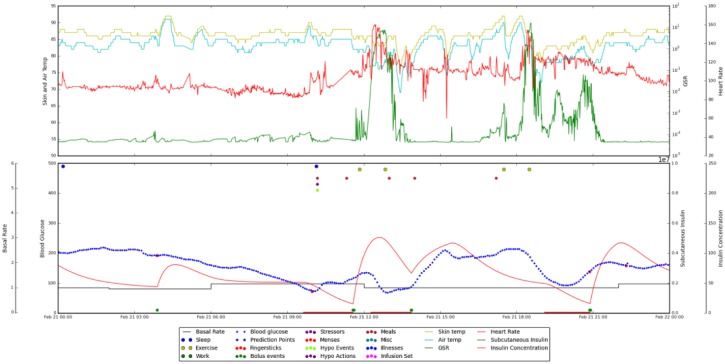
Figure 1.
Integrated data for a 24-hour period, from midnight to midnight. Data in the upper pane are from the Basis Peak band. Displayed are skin temperature (yellow), air temperature (cyan), heart rate (red), and GSR (green). The lower pane shows CGM data (blue), estimated insulin on board (red), and life events (colored dots at the top of the pane). The shoveling incidents occur at around noon and 6:00 pm. They are marked by drops in blood glucose level, increased GSR and heart rate, and decreased skin and air temperature.

