
Fig. 6.
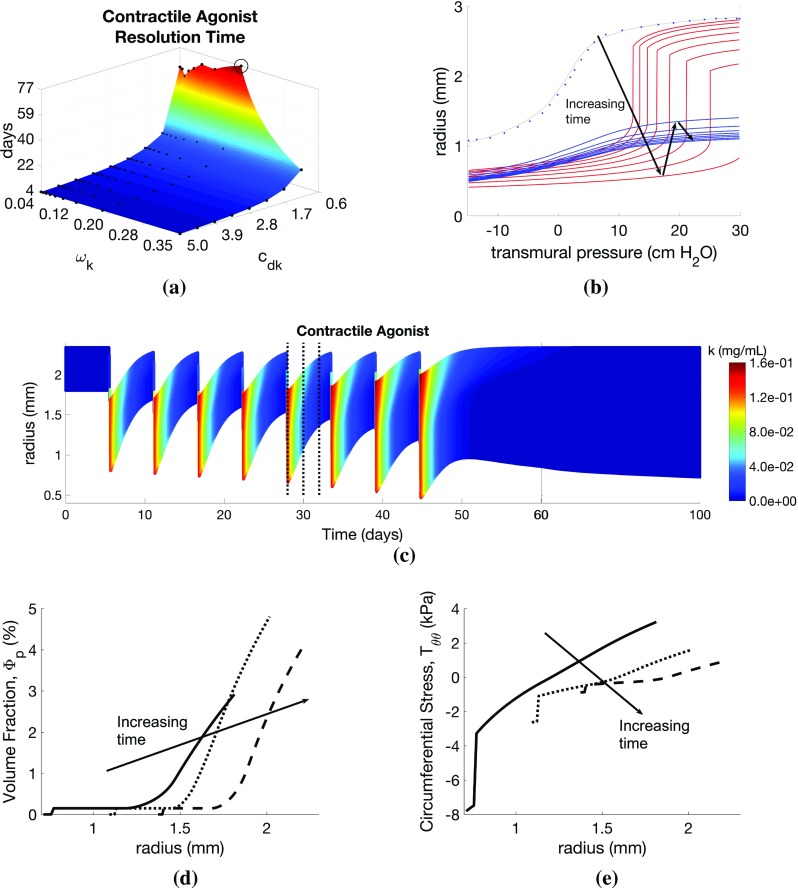
Effect of contractile agonist challenges on airway remodelling and mechanics. Variation in a agonist resolution rate with contractile agonist frequency () and resolution () parameter values. Illustrative results evaluated at the circled point on the surface: b pressure–radius curve (red lines correspond to points during challenge; blue lines indicate resolution period; blue dots indicate data of LaPrad et al. 2010), c contractile agonist concentration (k) as a function of radius and time, d and (e) as functions of radius at days 28, 30, and 32 (indicated by dotted lines on c). Additional plots are provided in Online Resources 4 and 5