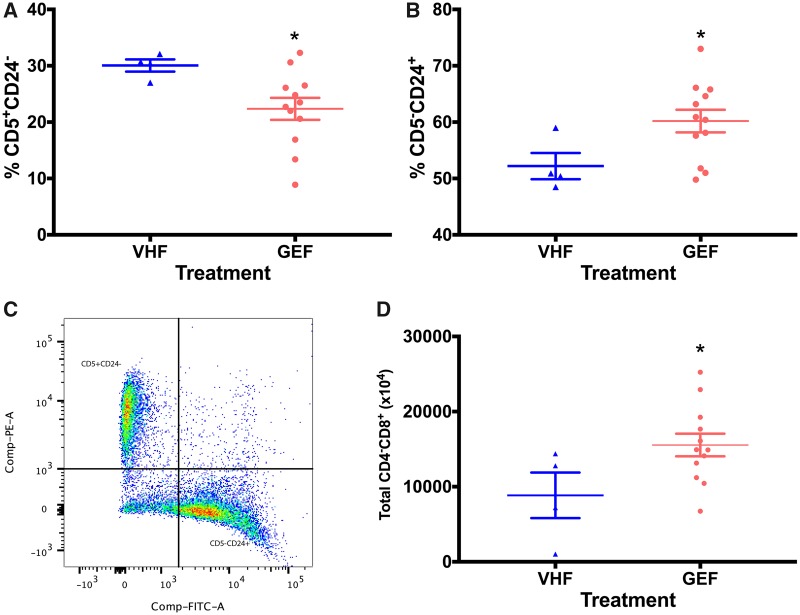
Figure 3.
GEN treatment caused alteration in subpopulations of splenic immune cells in female offspring. (A) The percentage of splenic CD5+CD24−. (B) The percentage of splenic CD5−CD24+. (C) The gating strategy for CD5CD24 markers. X-axis represents CD24, and y-axis represents CD5. (D) The total number of splenic CD4−CD8+ cells. VHF, female exposed to vehicle control (N = 4); GEF, females exposed to genistein (N = 12). * indicates p < .05.

