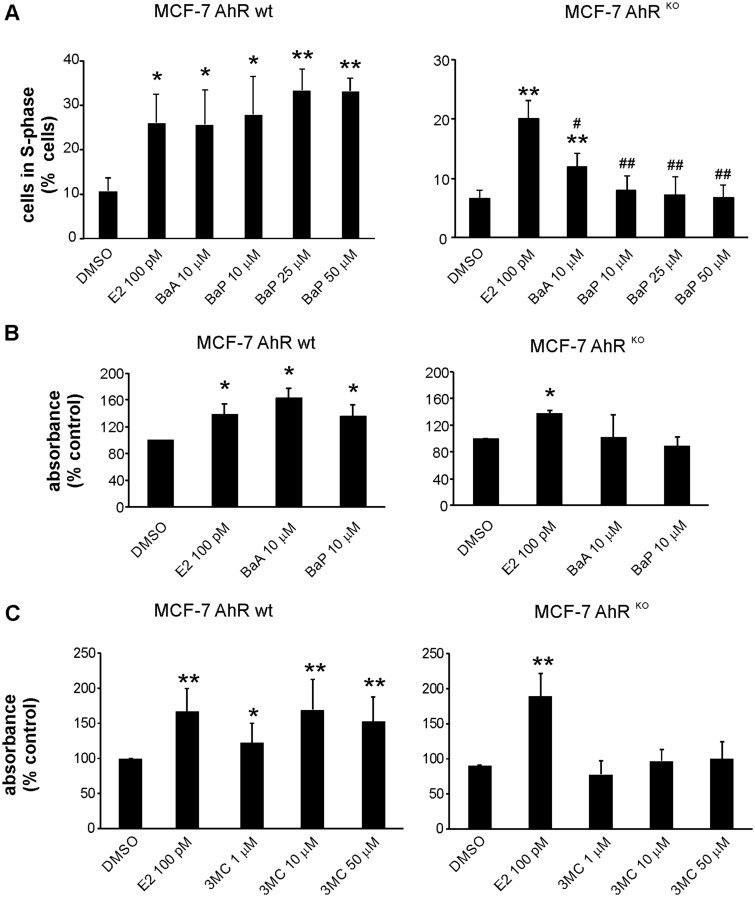
Figure 3.
Effects of BaA and BaP on cell cycle progression and cell proliferation in MCF-7 AhR wt and MCF-7 AhRKO cells. A, MCF-7 AhR wt and MCF-7 AhRKO cells were synchronized in experimental medium (phenol red-free DMEM/F12, supplemented with 5% dextran/charcoal-treated FBS) for 48 h and then exposed to DMSO (0.1%; negative control), E2 (100 pM; positive control), BaA (10 μM), or BaP (10, 25, and 50 μM) for 24 h. Percentage of cells in S-phase was determined using flow cytometry as described in Materials and Methods. The results shown here represent means ± SD of three independent experiments. Symbol “*” denotes significant difference (p < .05), as compared with DMSO-treated cells. Symbol “**” denotes significant difference (p < .01), as compared with DMSO-treated cells. Symbol “#” denotes significant difference (p < .05), as compared to E2-treated cells. Symbol “##” denotes significant difference (p < .01), as compared to E2-treated cells. B, MCF-7 AhR wt and MCF-7 AhRKO cells were synchronized in experimental medium for 48 h and then exposed to DMSO (0.1%; negative control), E2 (100 pM; positive control), BaA (10 μM), or BaP (10 μM) for 120 h. Cell proliferation was estimated using WST-1 assay as described in Materials and Methods. The results of absorbance detection were expressed relative to negative control (DMSO) and they represent means ± SD of three independent experiments. Symbol “*” denotes significant difference (p < .05), as compared to DMSO-treated cells. C, MCF-7 AhR wt and MCF-7 AhRKO cells were cultured and treated as in (B). Cells were exposed to DMSO (0.1%; negative control), E2 (100 pM; positive control), or indicated concentrations of 3MC for 120 h. Cell proliferation was estimated using WST-1 assay as described in Materials and Methods. The results of absorbance detection were expressed relative to negative control (DMSO) and they represent means ± SD of three independent experiments. Symbol “*” denotes significant difference (p < .05), as compared with DMSO-treated cells. Symbol “**” denotes significant difference (p < .01), as compared with DMSO-treated cells.

