Figure 6.
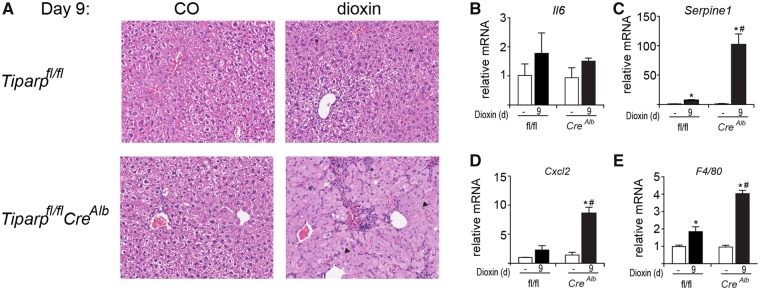
Increased liver inflammation and cytokine levels in dioxin-treated Tiparpfl/flCreAlb compared with Tiparpfl/fl mice. A, Representative H&E staining of livers from Tiparpfl/fl and Tiparpfl/flCreAlb mice (n = 4). Control animals were injected with CO and were euthanized on day 9. The asterisks (*) indicate focal inflammatory infiltration, and the arrowheads indicate microvesicular steatosis. All images are to the same scale. Hepatic (B) Il6, (C) Serpine 1, (D) Cxcl2, and (E) F4/80 mRNA levels were determined as described in the methods. Data represent the mean ± SEM (n = 4). *p < .05 2-way ANOVA compared with genotyped-matched control treated mice. #P < 0.05 2-way ANOVA compared with dioxin-treated Tiparpfl/fl mice.

