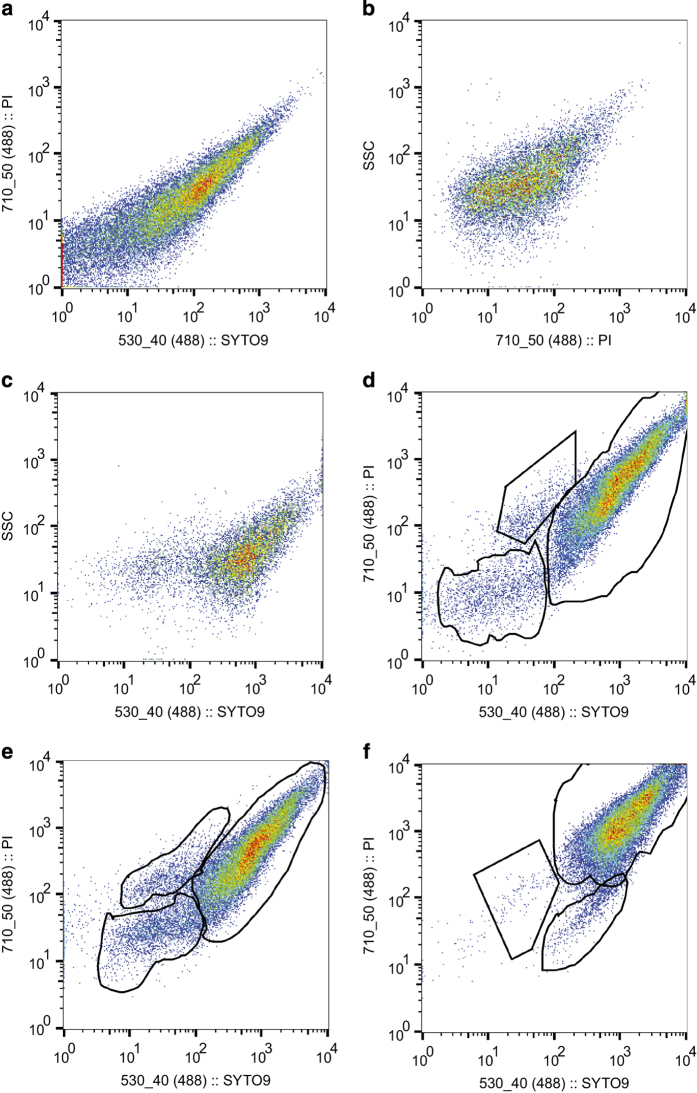
Figure 5. Flow cytometry analysis of Mycobacterium tuberculosis.
(a) Syto9 versus PI plot of the unstained sample, indicating a low signal therefore minimal auto fluorescence or background fluorescence. (b) Same sample stained only with PI. It can only penetrate cells with a damaged membrane either dead or not, which may explain the low signal since samples derived from actively growing cultures. (c) Sample stained with only Syto9. It penetrates every cell irrespective of their viability, which may explain the high signal. (d) Manual gating of population sub-sets using FlowJo of actively growing mycobacterial cultures stained with PI and Syto9. The population with a high Syto9 and PI signals was defined as the population of live cells with an intact membrane (LCIM). The population with a high PI signal and a relatively low Syto9 signal was defined as the population of dead cells (DC), while the population with a relatively low Syto9 and PI was considered as the population of live cells with a damaged membrane (LCDM). Every sample was analysed following that pattern. (e) Samples treated with 0.05% SDS for ~1 h displayed a slight increase of LCDM, indicating that a higher concentration of SDS or a longer exposure may damage a higher proportion of cell membrane. (f) When heat-treated, the DC population increased significantly.

