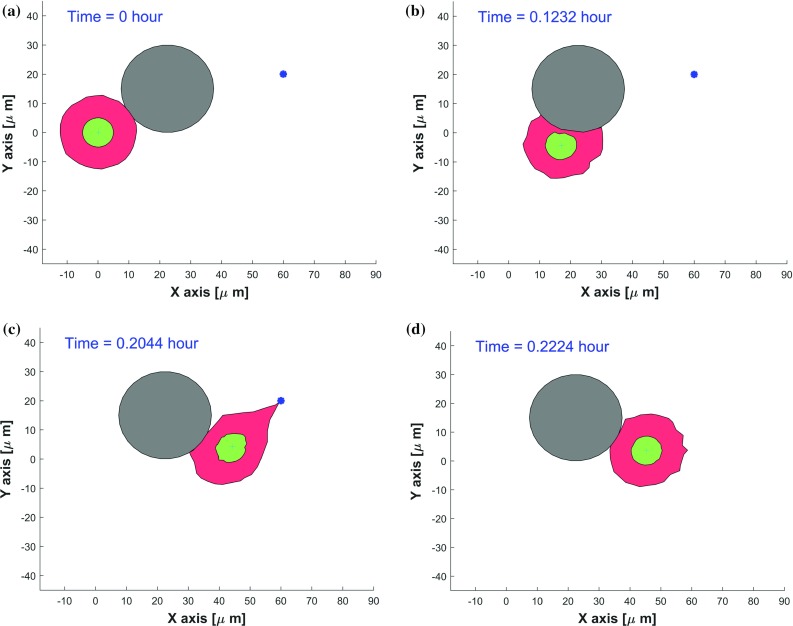
Fig. 3.

Consecutive snapshots of one cell migrating along a rigid obstacle in a 2D simulation. The cell, nucleus and obstacle are visualized by red, green and gray colors, respectively. A blue asterisk denotes a source secreting a chemokine with the secretion rate of . The CPU time of this model takes 2.20 s
