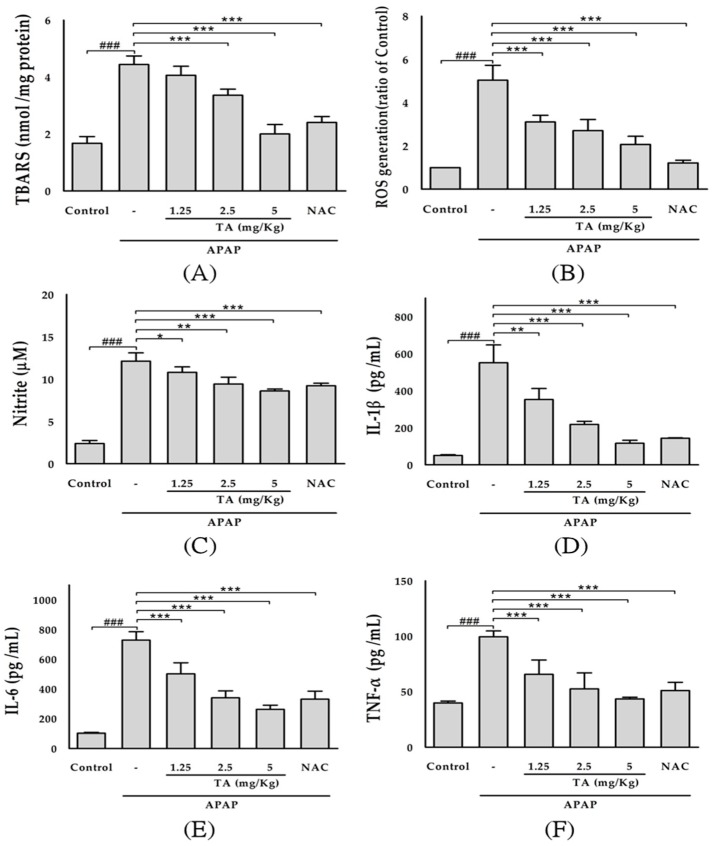
Figure 4.
Effects of TA on liver lipid peroxides levels (A); Effects of TA on serum ROS (B); NO (C); IL-1β (D); IL-6 (E); and TNF-α levels (F) in APAP-induced mice. The values are reported as the means ± S.E.M. of five mice per group. ### p < 0.01 compared with the control group; * p < 0.05, ** p < 0.01, and *** p < 0.001 compared with the APAP group.

