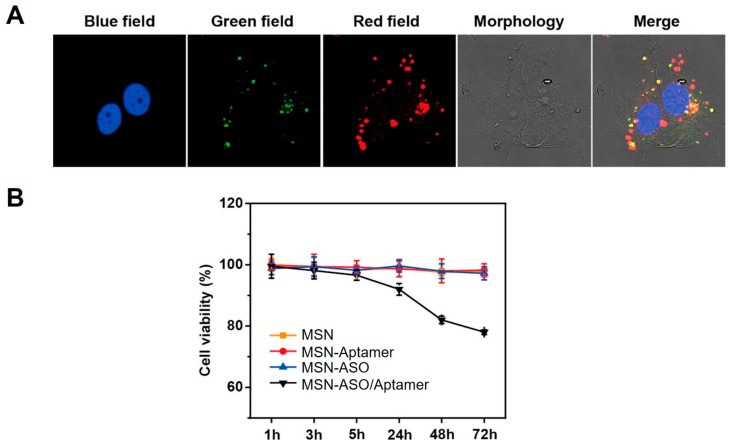
Figure 10.
(A) Confocal fluorescent images of MCF-7 cells post treatment with MSN-ASO/Aptamer. Blue field, nucleus staining. Green field, FAM-labeled ASO. Red field, MSN fluorescence; (B) Cellular viability of MCF-7 cells post treatment with MSN, MSN-aptamer, MSN-ASO, or MSN-ASO/Aptamer. ASO, 50 nM; MSN, 100 μg/mL. Adapted from reference [71] with permission.

