Figure 2.
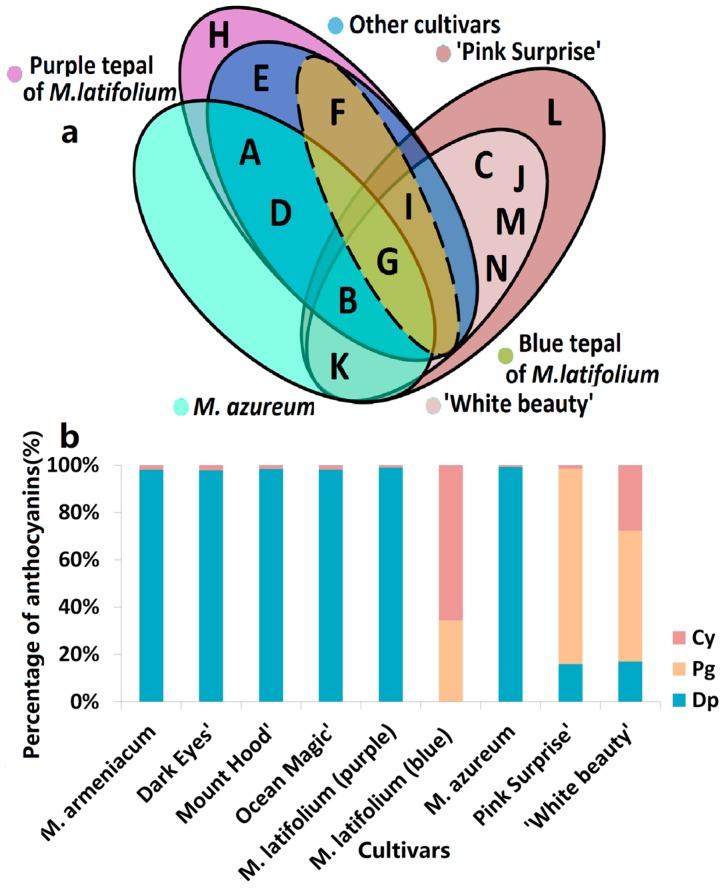
Anthocyanins distribution in tepals of eight grape hyacinth cultivars. (a) Venn diagram of anthocyanins distribution in different grape hyacinth cultivars. A–K: Refer to Table 1; (b) Percentage of Dp, Cy, Pg-type anthocyanins in tepals of different grape hyacinth cultivars. Flower color was recorded as three-dimensional CIEL*a*b* values and reproduced by photoshop using L, a*, b* values at stage 4. Cy—cyanidin; Dp—delphinidin; Pg—pelargonidin.

