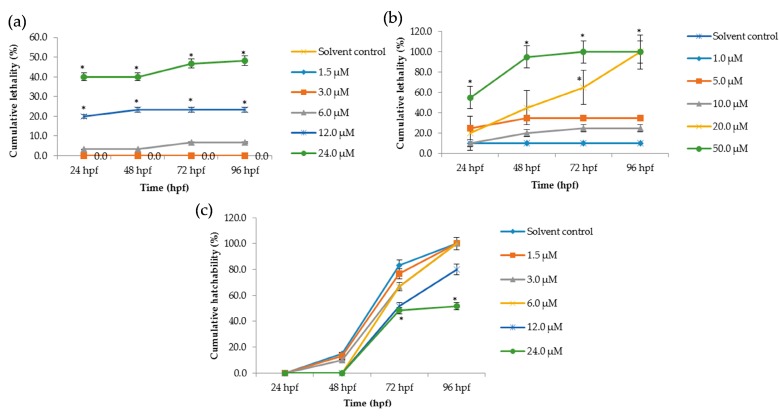
Figure 2.
Cumulative lethality and hatchability curves of embryos exposed to different concentrations of Tan-IIA. (a) Cumulative lethality curves of chorionic embryos; (b) Cumulative lethality curves of dechorionated embryos; (c) Cumulative hatchability curves of chorionic embryos. (n = 20 zebrafish per treatment; * p < 0.05, compared to control).

