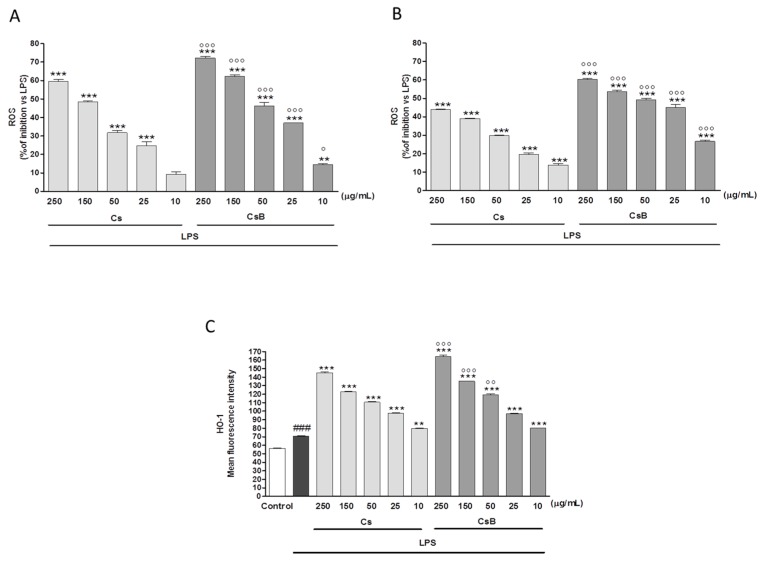
Figure 5.
Effect of Cs and CsB (250–10 μg/mL) on LPS-induced ROS in LPS-stimulated J774A.1 macrophages (Panel A and Panel B); Effect of Cs and CsB (250–10 μg/mL) on LPS-induced HO-1 (Panel C) in macrophages J774A.1. Values, mean ± s.e.m., are expressed as % of inhibition vs. J774A.1 treated with LPS alone and as mean fluorescence intensity. ### denotes p < 0.001 vs. control. *** and ** denote p < 0.001 and p < 0.01 vs. LPS alone. °°°, °° and ° denote p < 0.001, p < 0.01 and p < 0.05 vs. Cs.

