Figure 1.
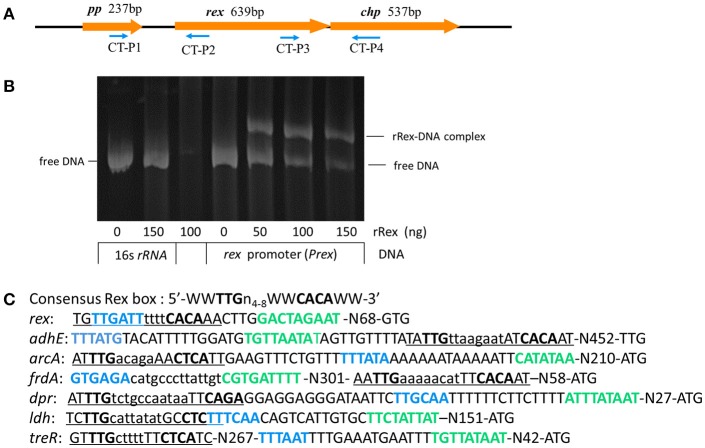
Identification and characterization of redox-sensing regulator Rex in SS2. (A) Schematic diagram of regions flanking rex, with the arrows indicating the direction of transcription and the numbers above indicating the sizes of the respective open reading frames in base pairs. (B) EMSA analysis shows interaction of rex promoter (Prex) with recombinant Rex (rRex) protein. Inclusion of rRex resulted in mobility shift and such interaction was concentration-dependent. (C) The promoter regions of selected genes identified in SS2-1 that contain putative Rex binding sites. The−35 regions (blue font) and−10 regions (green font) as determined by BPROM programs are shown in bold type and putative Rex-binding sites are underlined. W indicates A or T.

