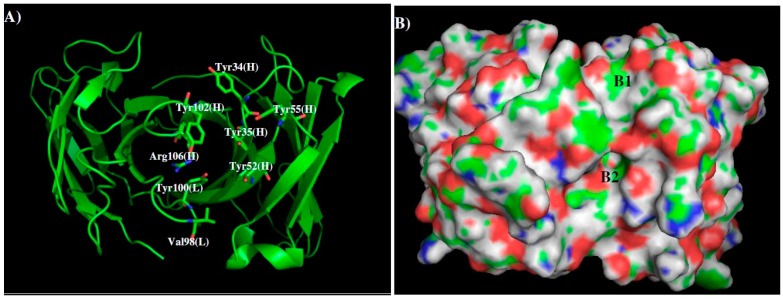
Figure 6.
The model structure (A) and surface presentation (B) of antibody 1G5.3. The contributing residues around CDR3 loop are highlighted in stick. The positively charged, negatively charged and hydrophobic surface regions are colored in blue, red and green in panel B. Two binding sites B1 and B2 are labeled. See context for the details.

