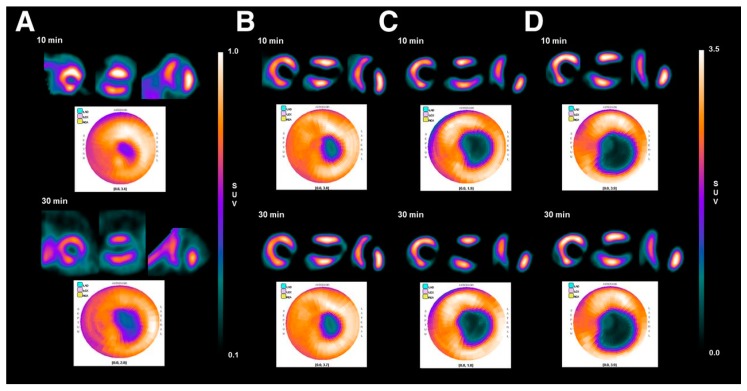
Figure 4.
Short-, vertical long-, and horizontal long-axis and polar map images of 13N-NH3 (A); 18F-FPTP (B); 18F-FHTP (C); or 18F-FETP (D) in each representative animal. Data were collected between 0–10 and 20–30 min after radiotracer injection (37 MBq). SUV = standardized uptake value [42].

