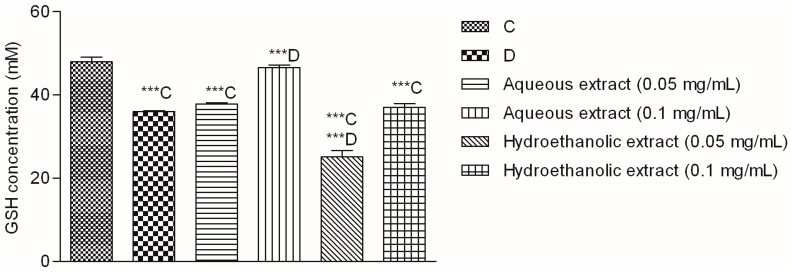
Figure 6.
Glutathione (GSH) concentration in Hep G2 cells. C—Cells in MEM containing 5.56 mM glucose; D—Cells in MEM supplemented with additional 30 mM glucose. ***C and ***D—value statistically different from C and D, respectively (p < 0.001, Dunnett’s test). Values are average of 3 replications ± SD.

