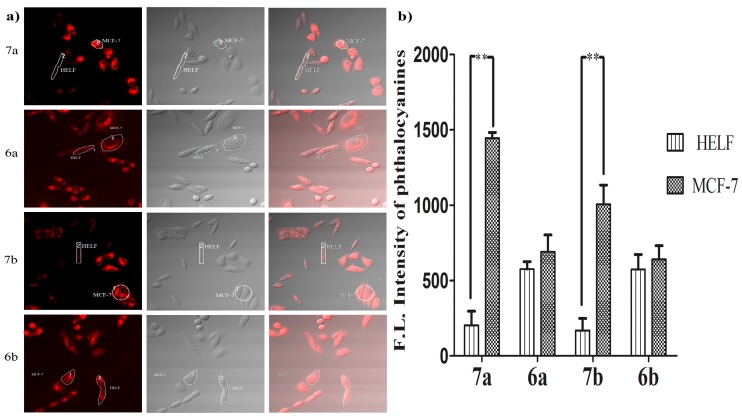
Figure 6.
(a) Confocal fluorescence images of mixed MCF-7 and HELF cells after incubation with 7a–7b and 6a–6b for 24 h (all at 5 µM); (b) comparison of relative intracellular average fluorescence intensity of phthalocyanines in MCF-7 and HELF cells (measured in the ROIs). Data are expressed as means ± SD. Statistical significance ** (p < 0.01).

