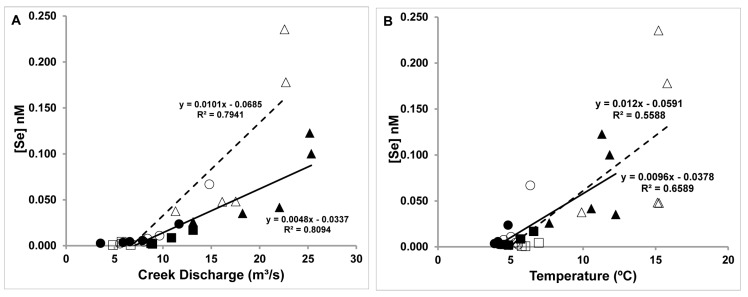
Figure 7.
Total Se concentration in nM vs. Creek discharge in m3/s (A) and Se concentration in nM vs. water temperature (°C) (B). Selenium concentrations in the creek water (solid symbol) spring and (open symbol) fall 2007 in nM. UF stands for Upper Fountain Creek (squares), MC Monument Creek (circles) and LW, Lower Fountain Creek (triangles) Regression lines are shown as solid for spring and dashed for fall. Details of the sampling sites were described previously [21].

