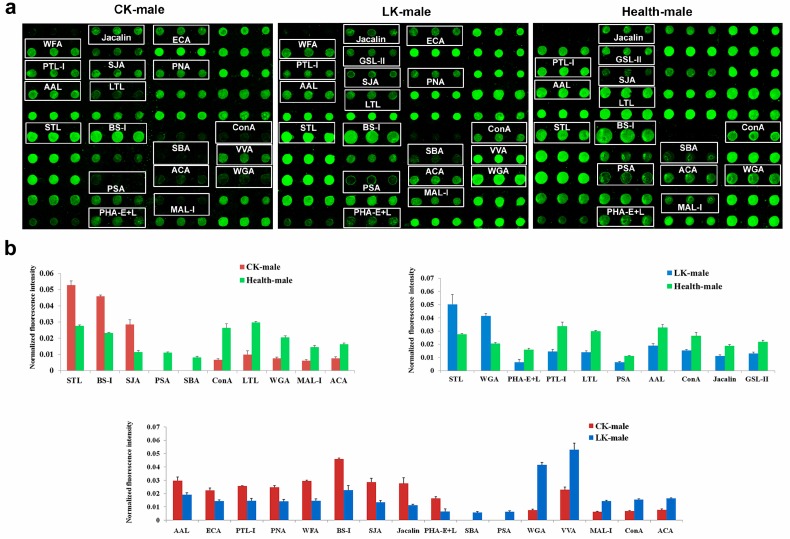
Figure 1.
Male salivary glycoprotein glycosylation patterns were determined by the binding of Cy3-labeled protein to 37 different lectins using a lectin microarray. CK: CKD, LK: LKD and Health: normal control. (a) Profiles of Cy3-labeled salivary proteins from patients with CKD, LKD, and normal control individuals bound to the lectin microarrays. The lectins, which exhibited remarkable differences in the staining intensity are marked with white frames; (b) Comparisons of the lectin-binding levels between the three groups. The bars represent mean ± SD measured from three replicate spots of lectins.

