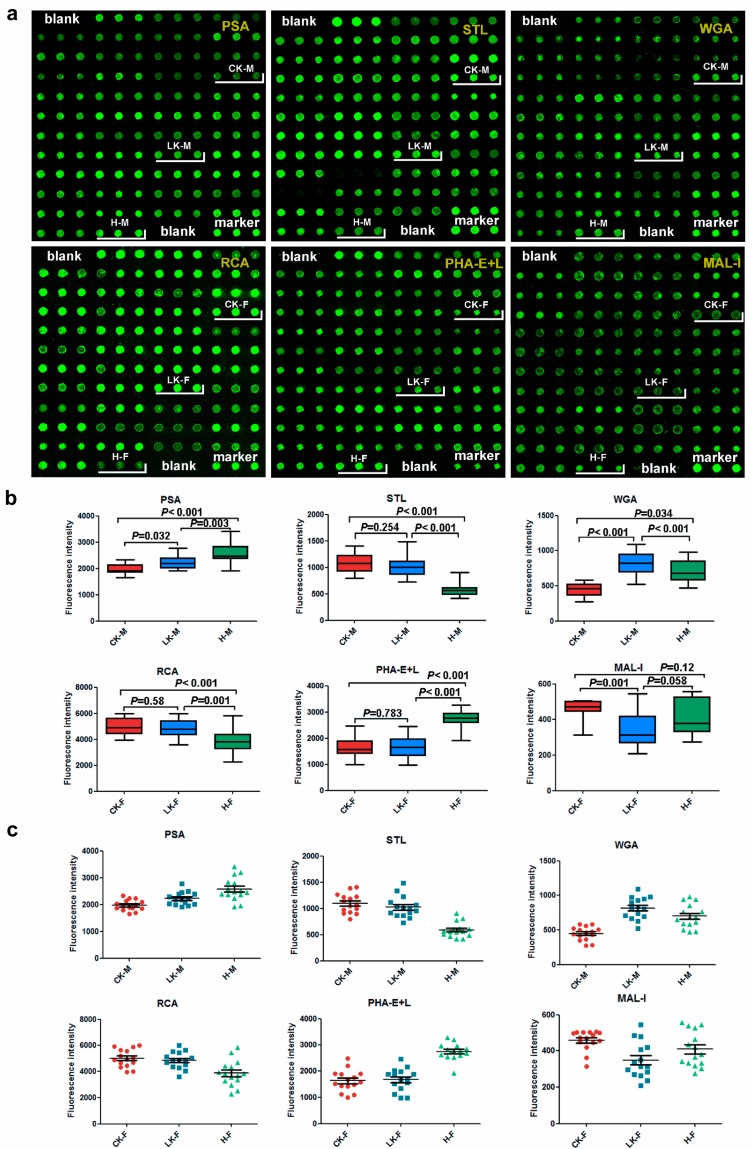
Figure 5.
Validation of the binding of 6 lectins (PSA, STL, WGA, RCA, PHA-E+L and MAL-I) to saliva glycoproteins. (a) Scanned images of Cy3-labeled lectins bound to the saliva microarrays; (b) Box plot analysis of the data for the six groups obtained from the salivary microarray. Error bars represent 95% confidence intervals for mean values. The statistical significance of differences between groups is indicated by the p-value. (c) Scatter plot analysis of the data for the six groups obtained from the saliva microarray. Lines represent mean ± SEM. CK-M: male patients with CKD, LK-M: male patients with LKD, H-M: male normal controls, CK-F: female patients with CKD, LK-F: female patients with LKD and H-F.

