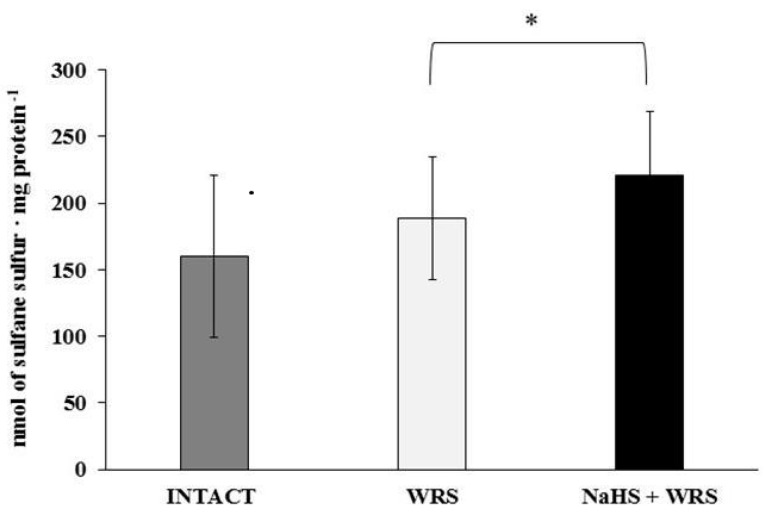
Figure 2.
The level of sulfane sulphur in the experimental groups. The experiments were carried out in gastric mucosa homogenates in three experimental group (Intact, WRS, WRS + NaHS). The data represent the mean value from two independent experiments. Each value is the mean of 8–20 repeats. Statistical analysis was performed using the Student’s t-test (* p < 0.05).

