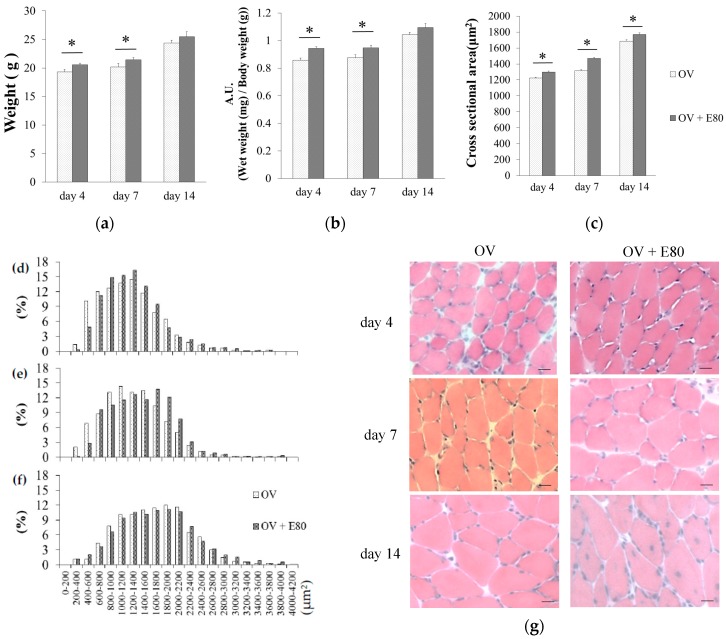
Figure 3.
E80 improves overload-induced muscle hypertrophy. (a–c) Muscle weight (a), muscle wet weight/body weight (b), and CSA (cross sectional area) (c) of the plantaris muscle in the OV and OV + E80 groups; (d–f) Distribution of plantaris muscle fibers in the OV and OV + E80 groups on days 4, 7 and 14; (g) Representative images of hematoxylin and eosin (H&E)-stained plantaris muscle. Values are presented as mean ± SEM. Scale bars are 20 µm. * indicates significant difference (p < 0.05) (n = 8). SEM, standard error of mean.

