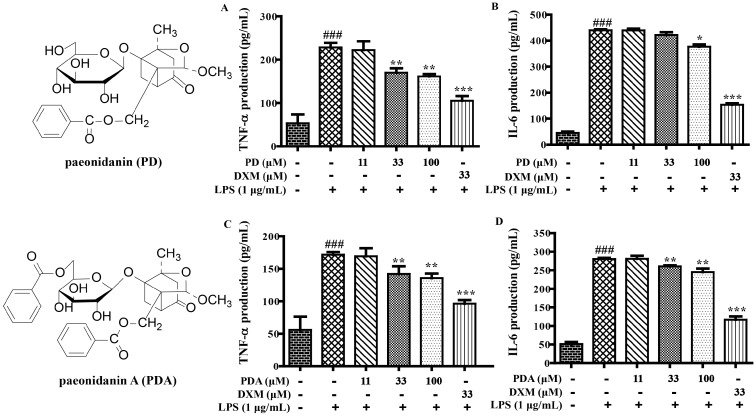
Figure 3.
The effects of paeonidanin (PD) and paeonidanin A (PDA) on the production of TNF-α and IL-6 in LPS-induced RAW 264.7 cells. The cells were treated with different concentrations of PD and PDA (0, 11, 33, and 100 μM) for 2 h, and were then stimulated with or without LPS (1 μg/mL) for 12 h. The culture medium was collected to detect the production of TNF-α ((A) and (C)) and IL-6 ((B) and (D)) were measured using Elisa kits. (### p < 0.001 vs. control group; * p < 0.05, ** p < 0.01, *** p < 0.001, vs. LPS group)

