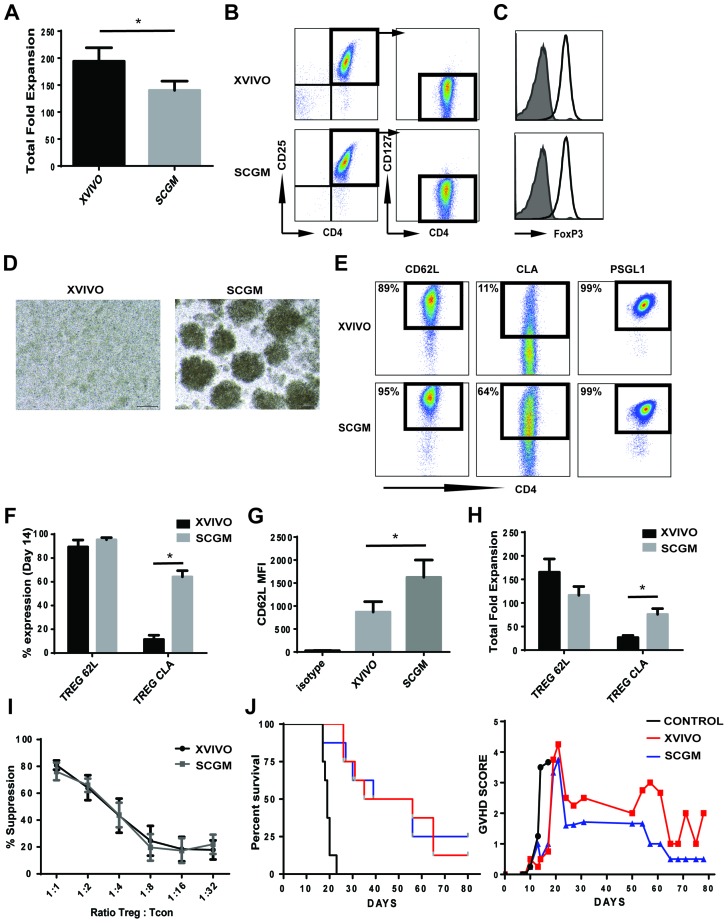
Figure 1. Ex vivo expansion of CB Tregs in XVIVO and SCGM.
(A) Total nucleated fold expansion of CB Tregs in XVIVO or SCGM. N=8, p<0.05. (B) Flow cytometric representation of CB Tregs (CD4+CD25+CD127-) in XVIVO or SCGM. (C) FoxP3 expression in CB Tregs grown in XVIVO (top) or SCGM (bottom). (D) Microscopic picture of CB Tregs at Day 7 growth in XVIVO or SCGM. (E) Representative flow cytometry plots of CB Treg CD62L (Left), CLA (middle) and PSGL1 (right) expression cultured in XVIVO or SCGM. (F) Total % expression of CD62L and CLA in CB Tregs. N=4, p<0.05. (G) CD62L MFI expression of CB Tregs cultured in XVIVO or SCGM. N=4, p<0.05. (H) Total fold expansion of CD62L or CLA expressing Treg cells in XVIVO or SCGM. N=4, p<0.05. (I) Total % suppression of Tcons (CD4+) by CB Tregs cultured in XVIVO (dark bar) or SCGM (light bar). N=4. (J) Kaplan-Meier survival curve of NSG mice in GVHD xenogenic model (left panel). GVHD scoring of mice (right panel). N=8. In Figure, error bars depict mean ± SEM.

