
Figure 5.
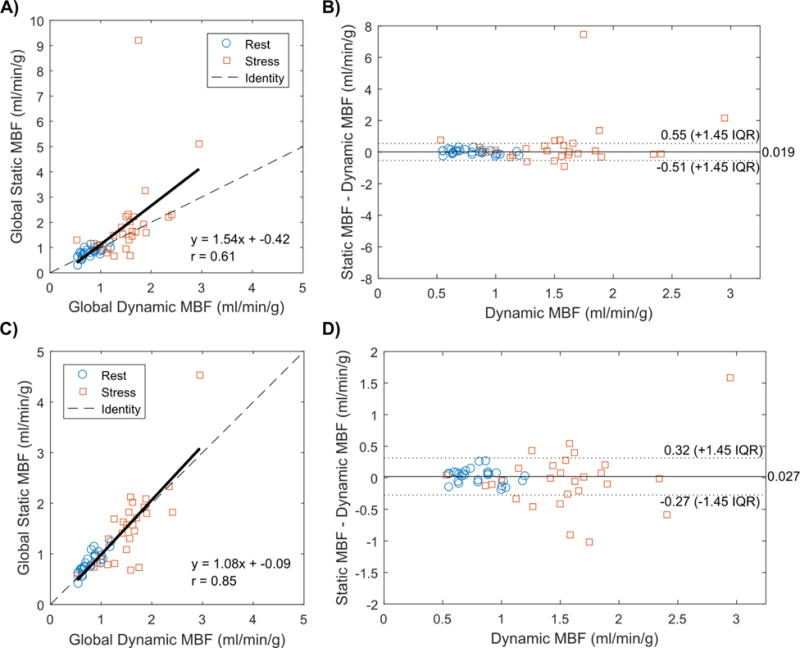
Static MBF Estimation Performance, with fixed myocardial baselines (panels A and B) or with study-specific myocardial baselines (panels C and D). Static MBF estimates for rest (blue circles) and stress (orange squares) are plotted against the reference standard dynamic MBF estimates (left panels). The dashed line is the identity line and the solid line is the line of best fit. The same data is presented in a Bland-Altman plot (right panels). The solid line is the median bias and the dotted lines represent the limits of agreement for non-gaussian data, all numbers in units of ml/min/g.