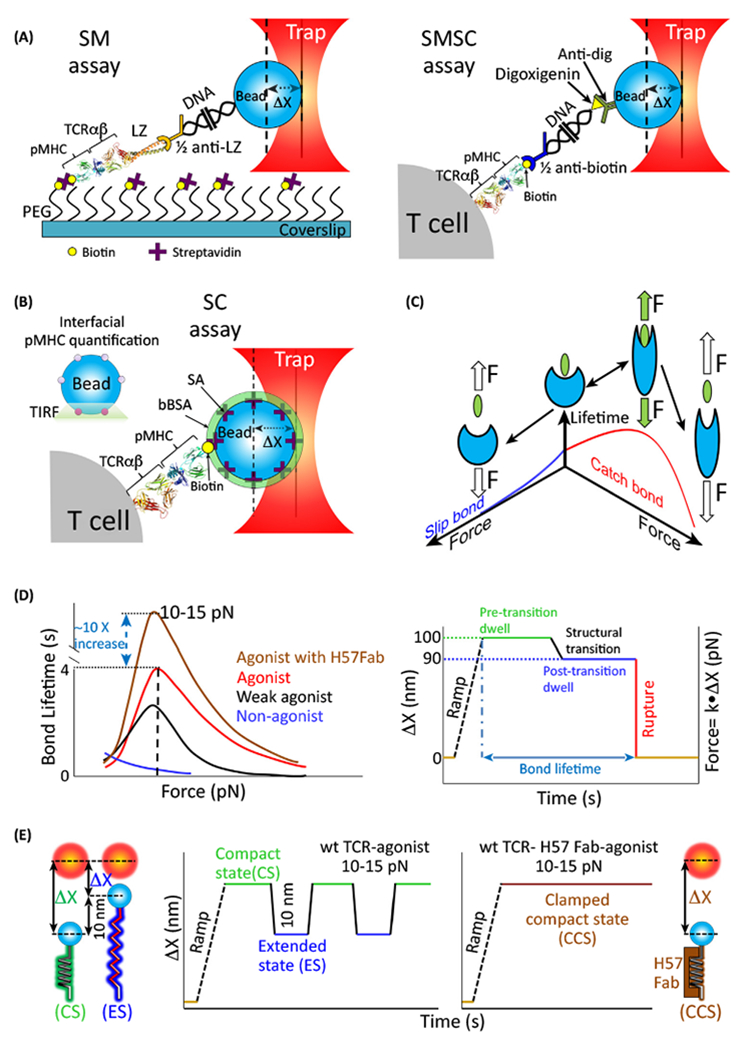
Figure 2. Mechanosensing Properties of the TCR Assessed by OT-Based Methods.

(A) TCR mechanosensing is revealed by three OT assays. SM assays use a surface-attached pMHC and an LZ-fused αβ TCR to probe the lifetime of single αβ TCR–pMHC bonds. Biotin–pMHC molecules are anchored at the tip of PEG molecules through a biotin–streptavidin–biotin sandwich system. LZ-fused αβ TCR is linked to a half-2H11 (anti-LZ) antibody functionalized 1010-bp DNA at one end. The other end of the DNA covalently binds to a polystyrene bead surface. The SMSC assay reverses the SM architecture. AT cell expressing a specific TCR is attached on the coverslip surface. The biotin–pMHC is linked to a half anti-biotin antibody functionalized 3500-bp DNA at one end. The other end of DNA with dig tag binds to an anti-dig coated polystyrene bead. (B) The SC assay uses a pMHC-coated bead [made through biotin–streptavidin (SA) interaction] to bind the TCR on the T cell surface. The bead surface is then saturated with bBSA to prevent nonspecific binding. A pMHC-coated bead is placed on the waist of the surface attached T cell. Directional force (shear or normal) is generated by moving the stage to a certain displacement. Quantification of the interfacial pMHCs is performed by TIRF. (C) Aslip bond without the potential to allosterically change the receptor conformation is destabilized by applied force. By contrast, force exerted on an optimal ligand facilitates the receptor structural transition and αβ TCR ligand interfacial complementarity to deliver additional binding energy that stabilizes the bond thus creating a catch bond. (D) Catch bonds are observed for agonist (VSV8) and weak agonist (L4) but not nonagonist (SEV9) upon interaction with the N15 TCR, representative of those expressed on CD8 T cells specific for the vesicular stomatitis virus. Specifically, the TCR ligated by H57 Fab, an antibody that directly interacts with the FG loop of the TCR Cb region, increases catch bond lifetime ~10 times at optimal force. Bond lifetime is defined as shown, namely the time between the force ramp when force is applied and bond rupture. Structural transition (~10 nm at 15 pN) is visualized during the lifetime measurement as a molecular extension/alteration so that the bead begins to return to the OT center. ΔX denotes displacement of bead out of the center of the trap. (E) Reversible structural transitions of a single molecular αβ TCR–pMHC interaction are seen under 10–15 pN. This is depicted as the extension and releasing of a spring-like TCR under a trapping force as visualized in a single continuous recording. Strikingly, a clamped compact state is observed for an H57 Fab-clamped αβ TCR under the same force magnitude. Abbreviations: bBSA, biotin–BSA; CS, compact state; dig, digoxigenin; ES, extended state; LZ, leucinezipper; PEG, polyethylene glycol; pMHC, peptide bound to MHC molecule; SA, streptavidin; SMSC, single molecule on single cell; TCR, T cell receptor; TIRF, total internal fluorescence microscopy.
