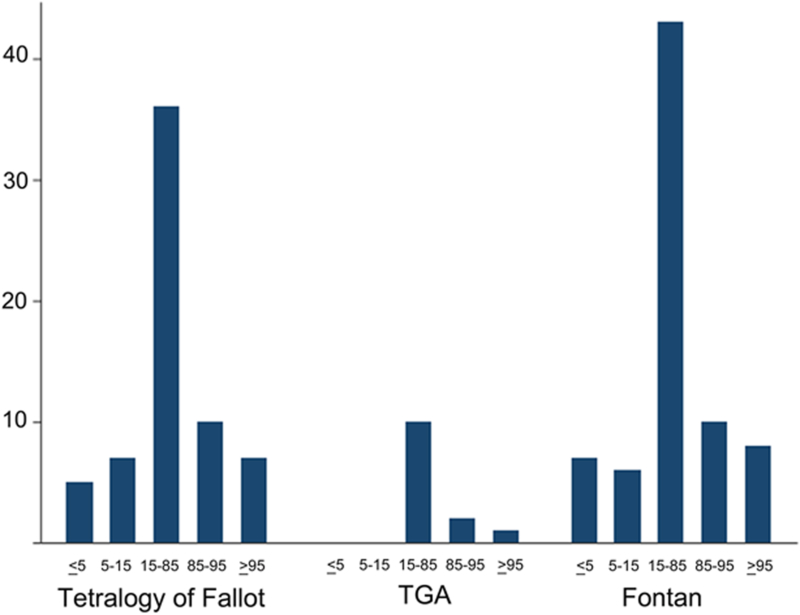
Figure 1: Distribution of body mass index in the study population.
Distribution of the subjects’ body composition sorted by diagnosis. Body composition is defined by BMI percentile for age and weight and divided by United States Centers for Disease Control categories: severely underweight (<5%), underweight (5–15%), normal weight (5–85%), overweight (85–95%), and obese (>95%).

