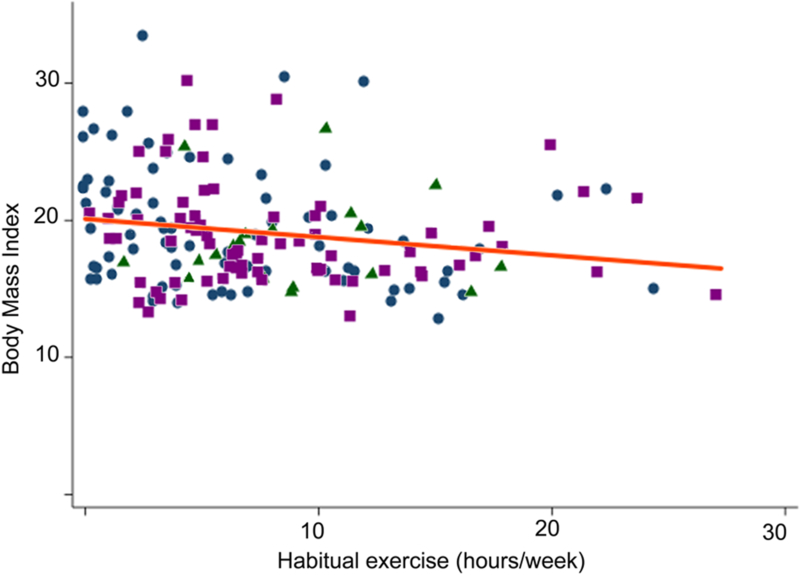
Figure 3: Distribution of BMI by hours of habitual exercise.
Scatterplot of subject habitual exercise (expressed in hours/week) and their BMI. Subject cardiac diagnoses are identified: tetralogy of Fallot (blue circles), TGA (green triangles), and Fontan subjects (purple squares). The line of best fit is also plotted for the entire population (orange line, beta=−0.13 95% CI: −0.24 to −0.03, p=0.01, r2=0.03).

