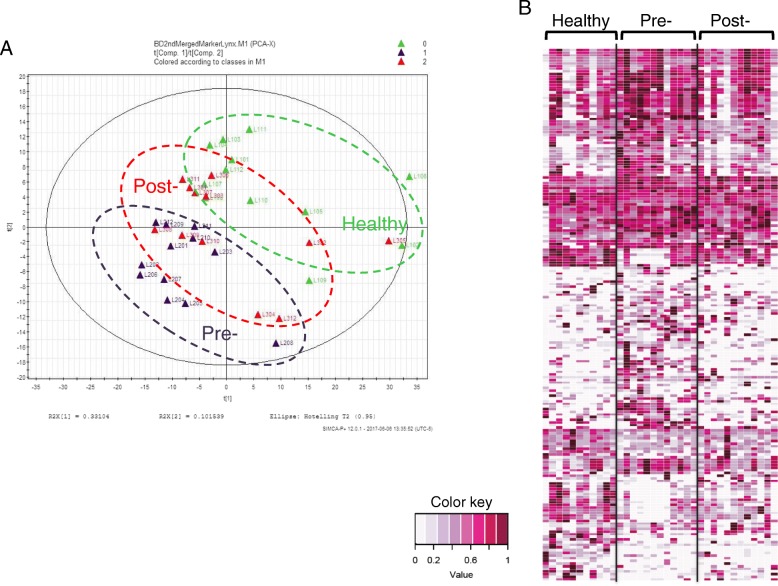
Fig. 2.
Serum lipidomic profile phenotype of treated Behçet’s disease (BD) patients moves towards that of the healthy cohort (HC). a PCA clustering plot of samples from these three groups with differential metabolites identified between pretreatment BD patients and HC. b Heat map of the metabolites with significantly different abundance between BD and HC

