
Figure 1.
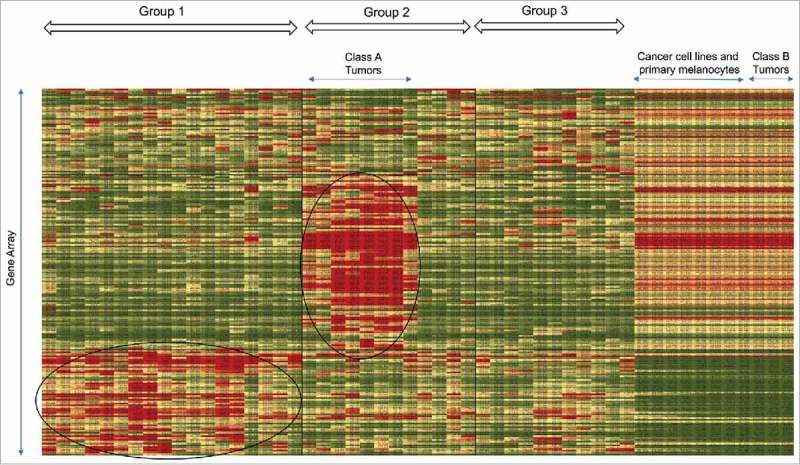
Heatmap generated from unsupervised hierarchical clustering analysis. 44 biopsy samples, 5 cell lines and 3 primary cells were aligned along the horizontal axis while genes were aligned along the vertical axis. The heatmap program generated groups 1–3 and we designated two classes of tumors, Class A and Class B.