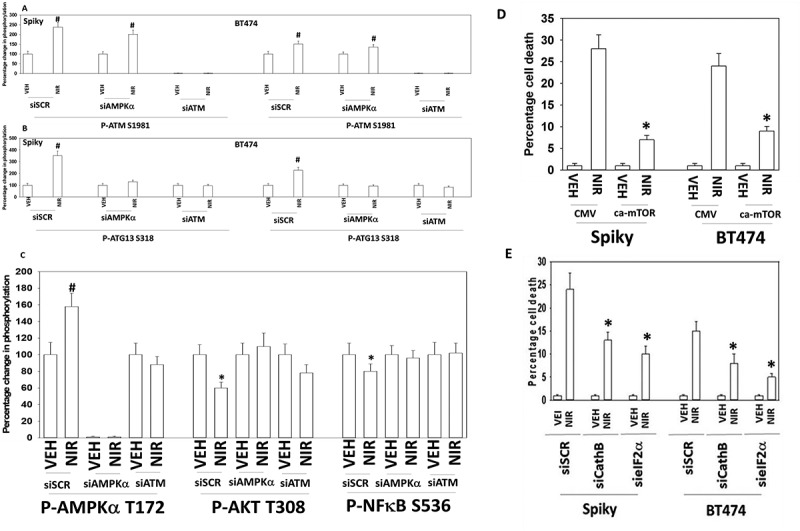
Figure 6.

Autophagy and lysosomal proteases, downstream of ATM and ATG13, play key roles in niraparib lethality. a. and b. Spiky and BT474 cells were transfected with a scrambled siRNA control or with siRNA molecules to knock down the expression of ATM or AMPKα. After 24h they were treated with vehicle control or with niraparib (2.0 μM). Cells were fixed in place and at least forty cells per condition were imaged in independent triplicate and the intensity ratio of phosphorylated protein levels to total protein expression plotted as a percentage of control treatment (n = 3 +/- SD). # p < 0.05 greater than vehicle control. c. Spiky ovarian cancer cells were transfected with a scrambled siRNA control or with siRNA molecules to knock down the expression of ATM or AMPKα. After 24h they were treated with vehicle control or with niraparib (2.0 μM). Cells were fixed in place and at least forty cells per condition were imaged in independent triplicate and the intensity ratio of phosphorylated protein levels to total protein expression plotted as a percentage of control treatment (n = 3 +/- SD). d. Spiky and BT474 cells were transfected with an empty vector control plasmid or with a plasmid to express activated mTOR. Twenty-four h after transfection cells were treated with vehicle control or with niraparib (2.0 μM). Cell viability after 24h of incubation was determined by live/dead assay (n = 3 +/- SD). * p < 0.05 less than corresponding value in CMV transfected cells. e. Spiky and BT474 cells were transfected with a scrambled siRNA (siSCR) or with siRNA molecules to knock down the expression of cathepsin B or eIF2α. Twenty-four h after transfection cells were treated with vehicle control or with niraparib (2.0 μM). Cell viability after 24h of incubation was determined by live/dead assay (n = 3 +/- SD). * p < 0.05 less than corresponding value in siSCR cells.
