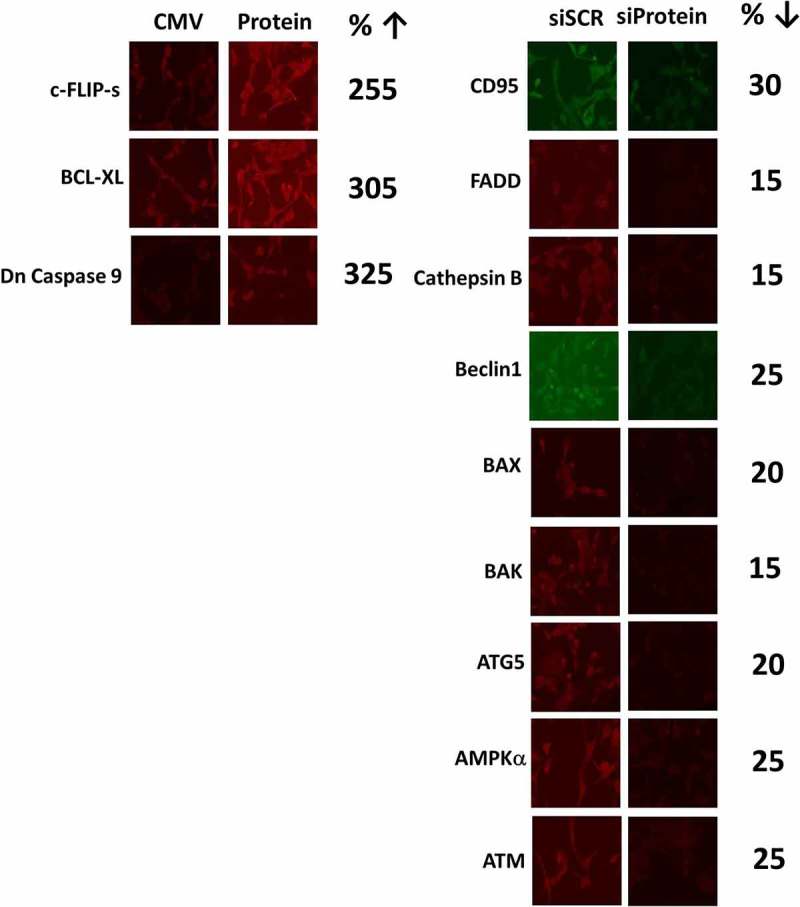
Figure 13.

Control studies demonstrating the knock down and over-expression of proteins, manipulated in the present studies. The percentage of protein remaining after knock-down is presented. The percentage increase of the expressed protein is presented.
