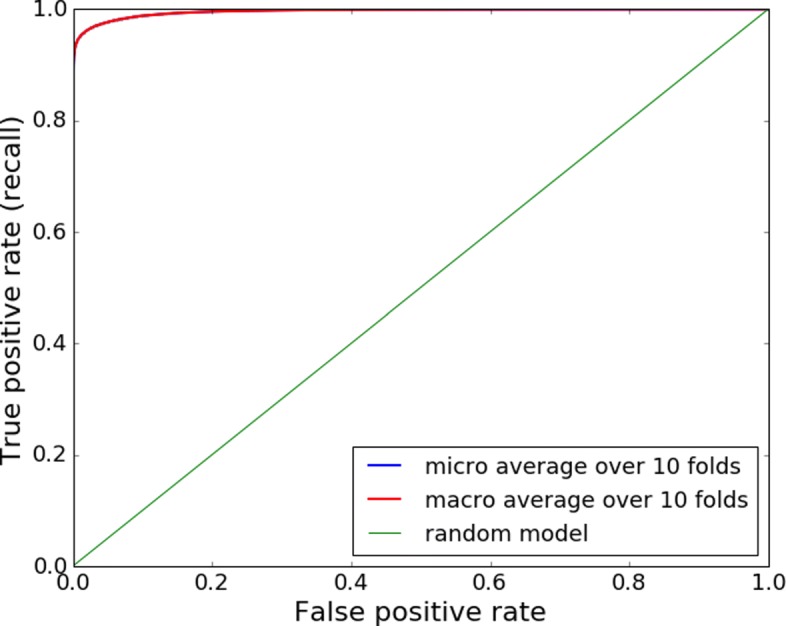
Fig. 2.

ROC curve of GenBank model when testing on GenBank data. The models trained in 10-fold cross validation, achieved 0.99 area under the ROC curve while classifying RSCU values obtained from genes registered at the GenBank. Notice that in case of equal fold sizes, micro and macro averages are equal
