
Fig. 2.
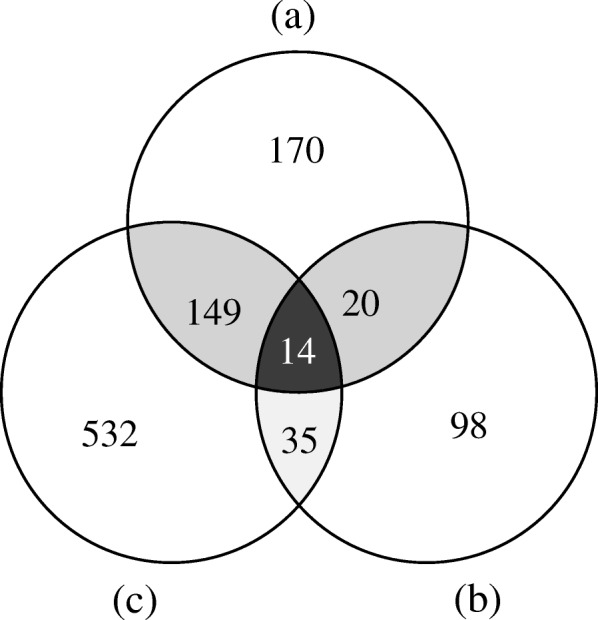
Each of the circles represents the number of SCNG loci homologous to the gene datasets of (a) APVO or (b) Vitaceae species, or detected by (c) the software markerminer. The grey and black overlapping area of the three circles correspond to the number of SCNGs shared between the results of the two, and three approaches, respectively.