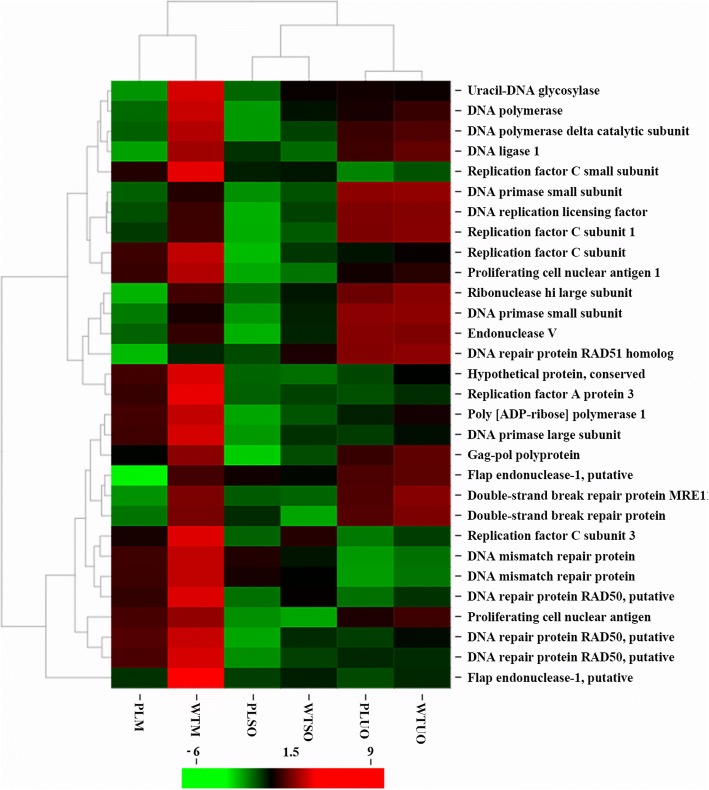
Fig. 5.
Clustered heatmap for DNA replication related genes. The mean log2− FPKM value of every gene in each group was normalized and used. The R package pheatmap-based on Euclidean distance and complete clustering was used for the analysis. WTM and PLM: merozoites of BJ-WT-130 and BJ-PL-98, respectively; WTUO and PLUO: unsporulated oocysts of BJ-WT-130 and BJ-PL-98, respectively; WTSO and PLSO: sporulated oocysts of BJ-WT-130 and BJ-PL-98, respectively

