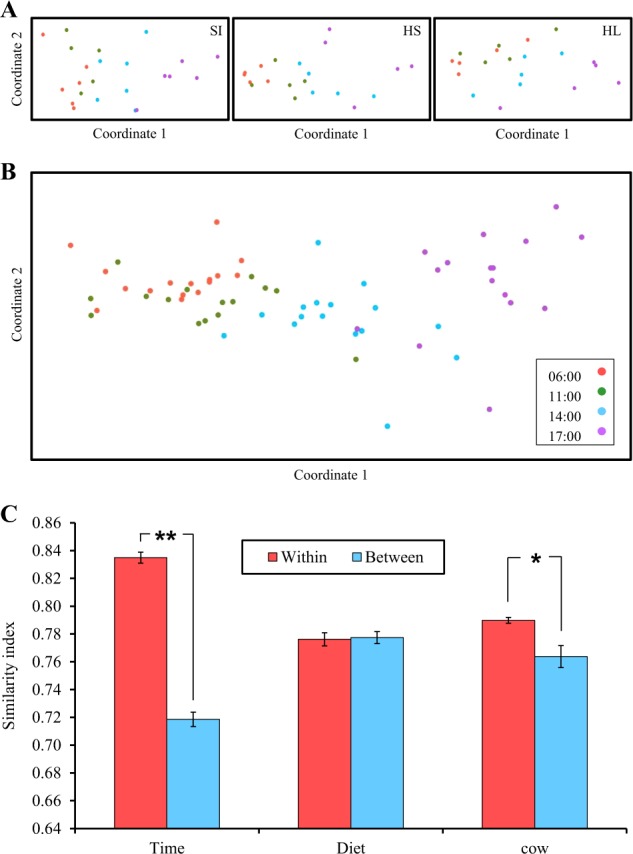
Fig. 2.

Community composition is determined by time after feeding and is independent of dietary regime and individual variability. a Similarity of bacterial communities within each dietary treatment. The distance between the samples is based on similarity in OTU composition (OTU similarity ≥0.97%) of each sample calculated using the Bray–Curtis similarity index and plotted using NMDS. Each point represents a different sample plotted according to their OTU composition and abundance. Confidence ellipses are plotted for each sampling–time group. b Similarity of the bacterial communities of all samples with no separation into dietary treatments. All parameters were calculated as in (a). c Average calculated Bray–Curtis similarity index for all samples relative to all of the others grouped as within or between the examined variance categories (*P < 0.05, **P < 0.001). The QIIME pipeline was used to compute weighted UniFrac metric similarity measurements. The y axis represents the degree of similarity, with 0 indicating no similarity between samples and 1 indicating that the samples are the same
