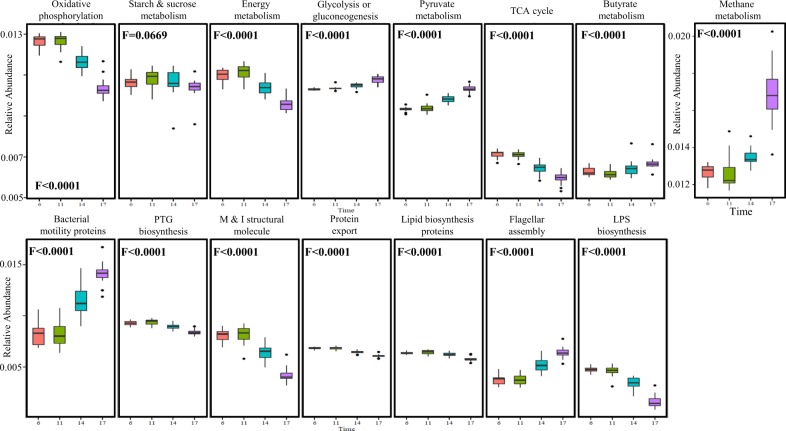
Fig. 4.
Marked functional changes of the coding capacity of the rumen microbiome as a function of time after feeding. Box plot of the microbiome functions that exhibited the most pronounced changes. Function values were calculated with the PICRUST program that uses an extended ancestral-state reconstruction algorithm to predict which gene families are present and then combines gene families to estimate the composite metagenome. F values represent the significance of the quadratic change over time

