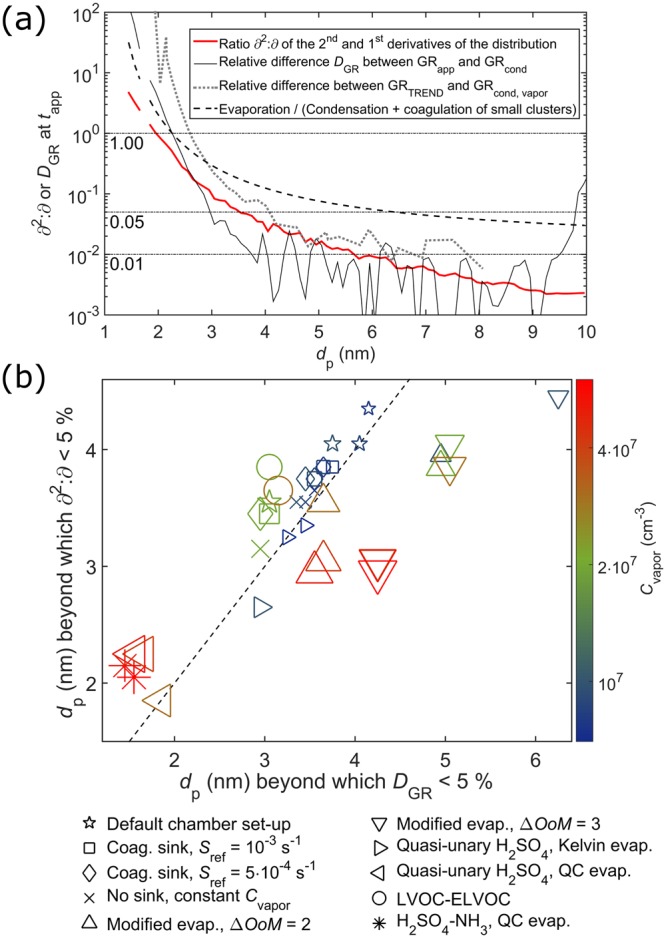
Figure 2.

Panel (a): Relative difference DGR = abs[(GRcond − GRapp)/GRapp] between GRapp and GRcond (thin solid line), and the ratio ∂2:∂ of the second and first derivatives of the distribution at tapp (thick solid line) for LVOC at CLVOC = 2∙107 cm−3. Dotted grey line shows the difference between GRTREND and GRcond,vapor, where GRcond,vapor includes only vapor (see Methods). Black dashed line shows the particle stability as the ratio of the evaporation and condensation rates. Panel (b): The size at which GRapp and GRcond converge within 5%, and the size at which ∂2:∂ falls below 5% for different simulation cases (see Supplementary Information). The color and size of the markers depict the final vapor concentration Cvapor.
