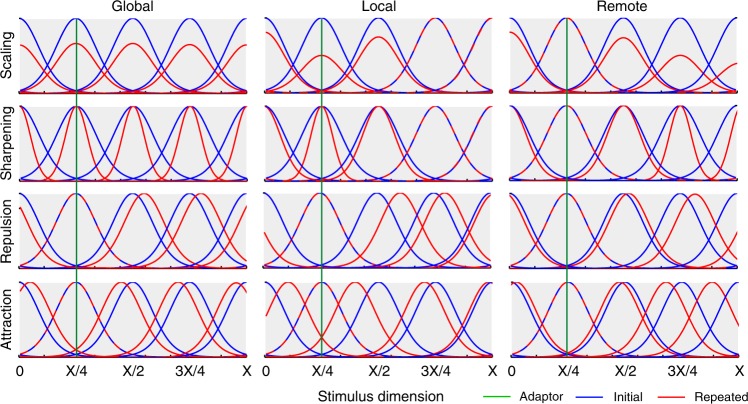
Fig. 1.
Example tuning curves along a stimulus dimension (ranging from 0 to X), both before (blue) and after (red) repetition of a single stimulus (with value X/4, shown by green line) according to the twelve different neural models of repetition suppression, created by crossing four mechanisms (rows) with three domains (columns). Mechanisms: scaling – adaptation reduces response amplitude, sharpening – adaptation tightens tuning-curves, repulsion – the peak of tuning-curves moves away from the adapting stimulus, attraction – the peak moves towards the adapting stimulus. Domains: global – all tuning-curves in a voxel are affected, local – tuning-curves close to the adapting stimulus are affected most, remote – tuning-curves close to the adapting stimulus are affected least. For illustrative purposes, only five neural populations are shown, equally-spaced along the stimulus dimension. Note that this figure illustrates the Gaussian tuning-curves used for Experiment 1 (see Supplementary Figure 1 for illustration of von Mises tuning-curves used for Experiment 2)

