Fig. 3.
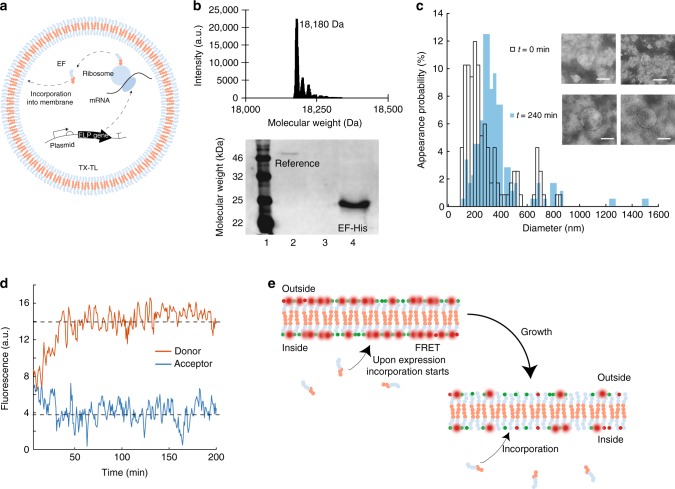
Expression of ELP and vesicle growth. a Illustration of the expression of EF inside a vesicle using TX-TL. b Top: Mass spectroscopy of full length EF. Bottom: Western blot of EF-His expressed in TX-TL within vesicles after 0 min (lane 3), where no EF-His is detected and after 240 min (lane 4). The reference is a histidine-tagged helicase (lane 2). c Size distribution of vesicles at the beginning of EF expression (t = 0 min) with a peak value of 149 nm and after 240 min with a peak value of 330 nm using TEM. Inset: Typical TEM images at t = 0 min (top) and t = 240 min (bottom). Scale bar: 200 nm. d Donor fluorescence (red) of dye-labeled EF located in the membrane and acceptor fluorescence (blue) of a labeled EF. The dashed lines are a guide to the eye. e Illustration of the FRET assay used. The vesicles are formed using Cy5-EF and Cy3-EF. Upon expression of unlabeled EF and its incorporation into the membrane the mean distance between the FRET pairs rises and the donor signal increases

