Figure 5.
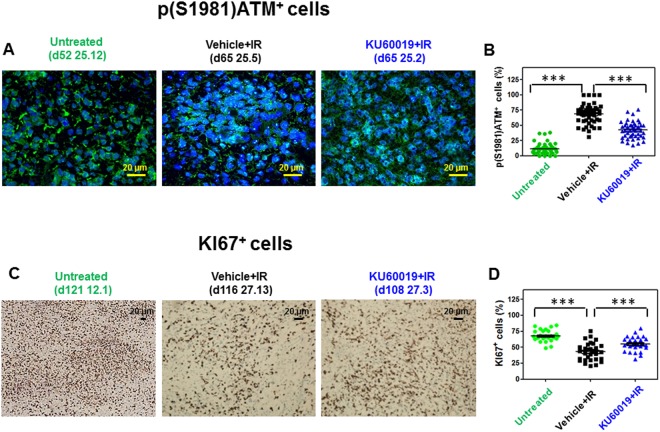
In vivo ATM inhibition by KU60019. (A) Immunodeficient mice bearing orthotopic COMI GB developed for 52 days were inoculated by CED at the tumor site with 12.5 µl of 250 µM KU60019 or vehicle (2.5% ethanol in 0.9% NaCl) followed by irradiation with 2.5 Gy at d56, 57 and 58. The radiosensitization cycle was then repeated with CED at d59 followed by 2.5 Gy at d63 and d64 (total dose delivered: 12.5 Gy). At d65, moribund animals were euthanized by CO2 asphyxiation, the brains removed and slices obtained by cryostat sectioning. The orthotopic tumor tissue was processed for IF analysis with rabbit monoclonal antibody to ATM-phospho S1981 as described under Materials and Methods. Reduced pATM foci in [KU60019 + IR (2.5 Gy × 5)] as compared to [Vehicle + IR (2.5 Gy x 5)] -treated tumors is shown. Mouse ID numbers 25.12, 25.5 and 25.2 are indicated for the sake of reference with the days (d) of tumor development. (B) The frequency distributions of the percentages of ATM-phospho S1981-positive cells in 45 randomly selected fields are shown. The three asterisks indicate P < 0.0001 for the differences of the frequency distributions between the indicated groups as determined by ANOVA (25.5 vs 25.12 mean difference +57% of p(S1981)ATM+ cells, 95% CI of difference +50 to +64%; 25.2 vs 25.5 mean difference −26% of p(S1981)ATM+ cells, 95% CI of difference −19 to −33%; 25.12 vs 25.2 mean difference −31% of p(S1981) ATM+ cells, 95% CI of difference −24 to −38%). (C) Persistent increase of KI67 staining in KU60019-treated mice 42 days after CED. At d52 of tumor development, COMI tumor-bearing mice were i.c.- injected by CED with 20 µl of 250 µM KU60019 or vehicle (2.5% ethanol in 0.9% NaCl) followed by irradiation with 0.5 Gy at d56, 57 and 58. The radiosensitization cycle was then repeated with CED at d59 followed by 1.5 Gy at d63 and with CED at d66 followed by 1.5 Gy at d70, 71 and 72 (total dose delivered: 7.5 Gy) Mouse ID numbers 12.1, 27.13 and 27.3 are indicated for the sake of reference with the days (d) of tumor development. (D) The frequency distributions of the percentages of KI67-positive cells in 30 randomly selected fields are shown. The three asterisks indicate P < 0.0001 for the differences of the frequency distributions between the indicated groups as determined by ANOVA (27.13 vs 12.1 mean difference −25% of KI67+ cells, 95% CI of difference −18 to −32%; 27.3 vs 27.13 mean difference +12% of KI67+ cells, 95% CI of difference +5 to +19%; 12.1 vs 27.3 mean difference +13% of KI67+ cells, 95% CI of difference +6 to +19%).

